
02 - The Web UI
In this tutorial you’ll bring up the Cloacina web UI, connect it to a
running cloacina-server, and watch a workflow execute in real time.
By the end you’ll know how the UI authenticates, where each control
plane view lives, and how the live execution stream works.
- How to stand up the full UI demo stack with one command.
- How to connect the UI to a server with a tenant API key.
- How to upload a packaged workflow, execute it, and follow the run live as its events stream in.
- Where the demo’s continuous workload comes from so there’s always something to watch.
- A checkout of the cloacina repository with
angrealand Docker (including Compose) available. Everything else — the server, compiler, execution-agent fleet, and UI — builds and runs inside containers, so you don’t need Rust or Node installed on your host.
From the repo root:
angreal ui up
This builds and starts the docker compose demo stack: PostgreSQL, Kafka,
a CORS-enabled cloacina-server, an in-cluster cloacina-compiler (so
packages you upload actually build), a 3-agent execution fleet that runs
the work, a one-shot packer + seed that loads the demo packages, and a
live computation-graph producer. The first run builds images and
compiles the demo packages, so it takes a few minutes. When it’s ready
it prints the connection details:
  UI:      http://localhost:8082
  Server:  http://localhost:8080
  Connect with →  server:  http://localhost:8080
                  api key: clk_demo_bootstrap_key_0001
                  tenant:  public
Why the compiler?
cloacina-serverdoes not build uploaded packages itself — a separatecloacina-compilerpolls the database and compiles them. The demo stack runs one for you; without it, uploaded workflows would sit inpendingforever.
Open http://localhost:8082. You’ll land on the Connect screen, with
the server URL and tenant (public) prefilled. Paste the bootstrap API
key printed above and click Connect. The key is held in
sessionStorage for the tab only — closing the tab clears it.
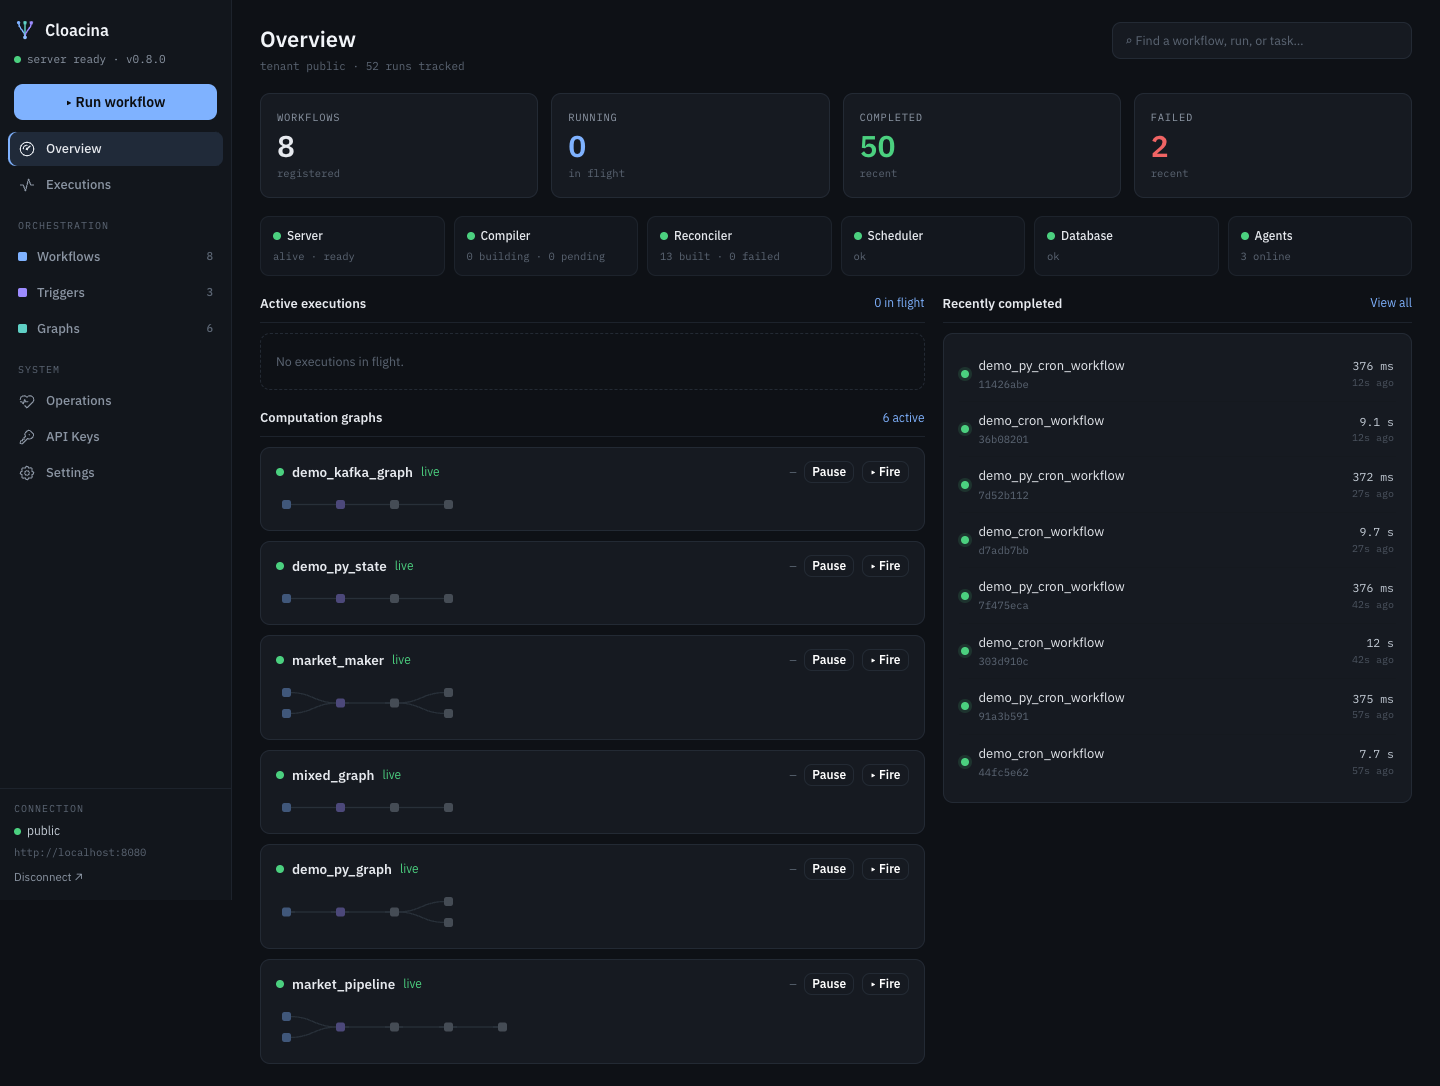
You’re now on the Overview dashboard: a status rollup, a graph summary, and the most recent executions.
The console is organized into Orchestration (Workflows, Triggers, Graphs) and System (Operations, Agent fleet, API Keys, Accounts, Settings) sections. Here’s what each view gives you.
The landing dashboard: counts for registered / running / completed / failed runs, a live service health row (server, compiler, reconciler, scheduler, database, agents), in-flight executions, the computation graphs with mini-DAGs you can Pause / Fire inline, and the most recent completed runs.
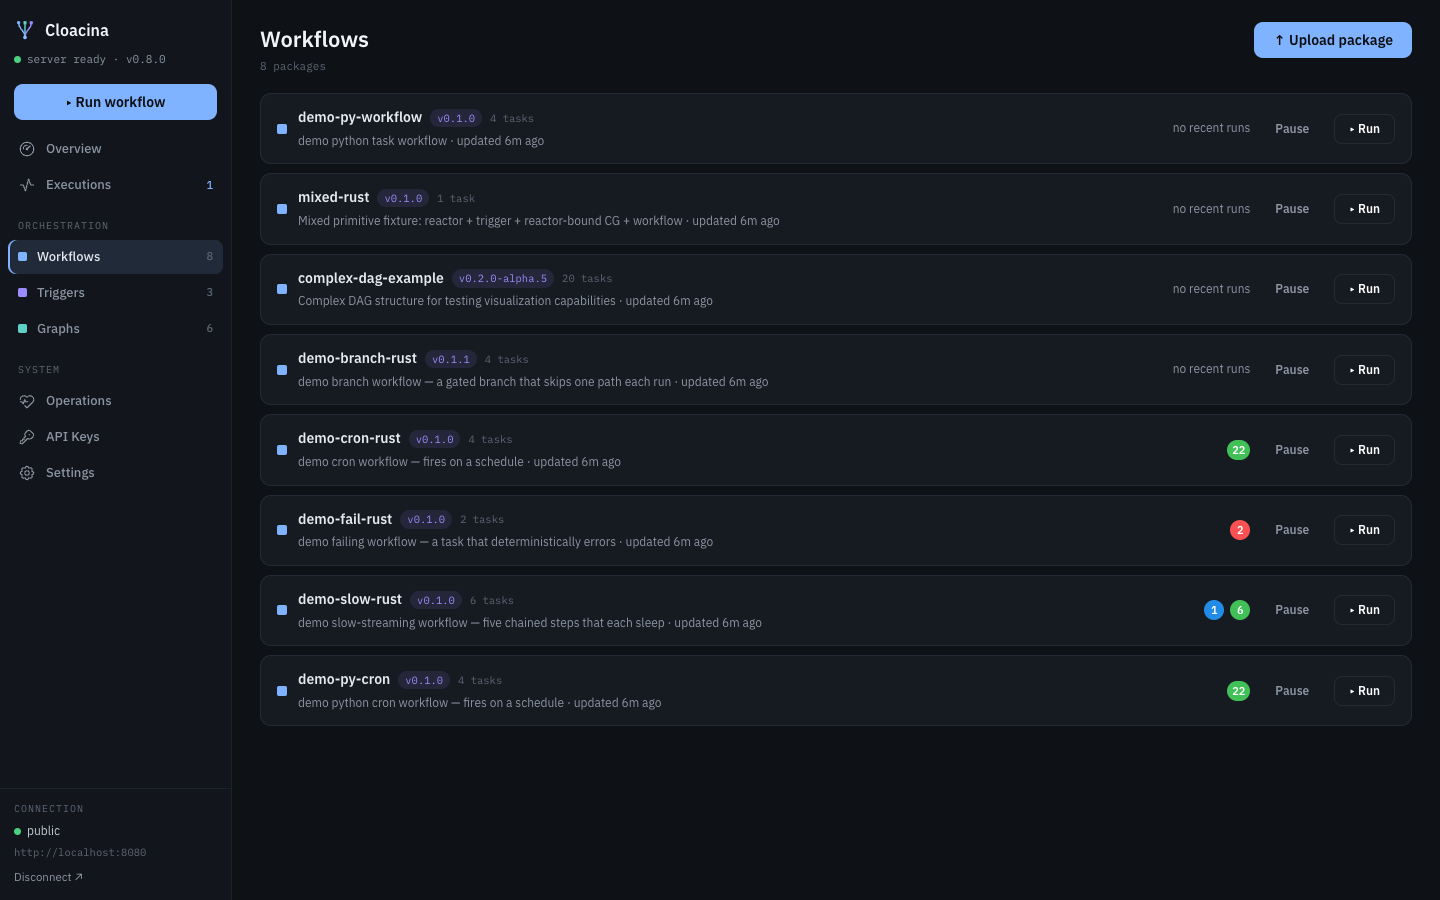
The package catalog — every registered workflow with its task count,
run-status chip, and a Run action. Upload package registers a new
.cloacina archive.
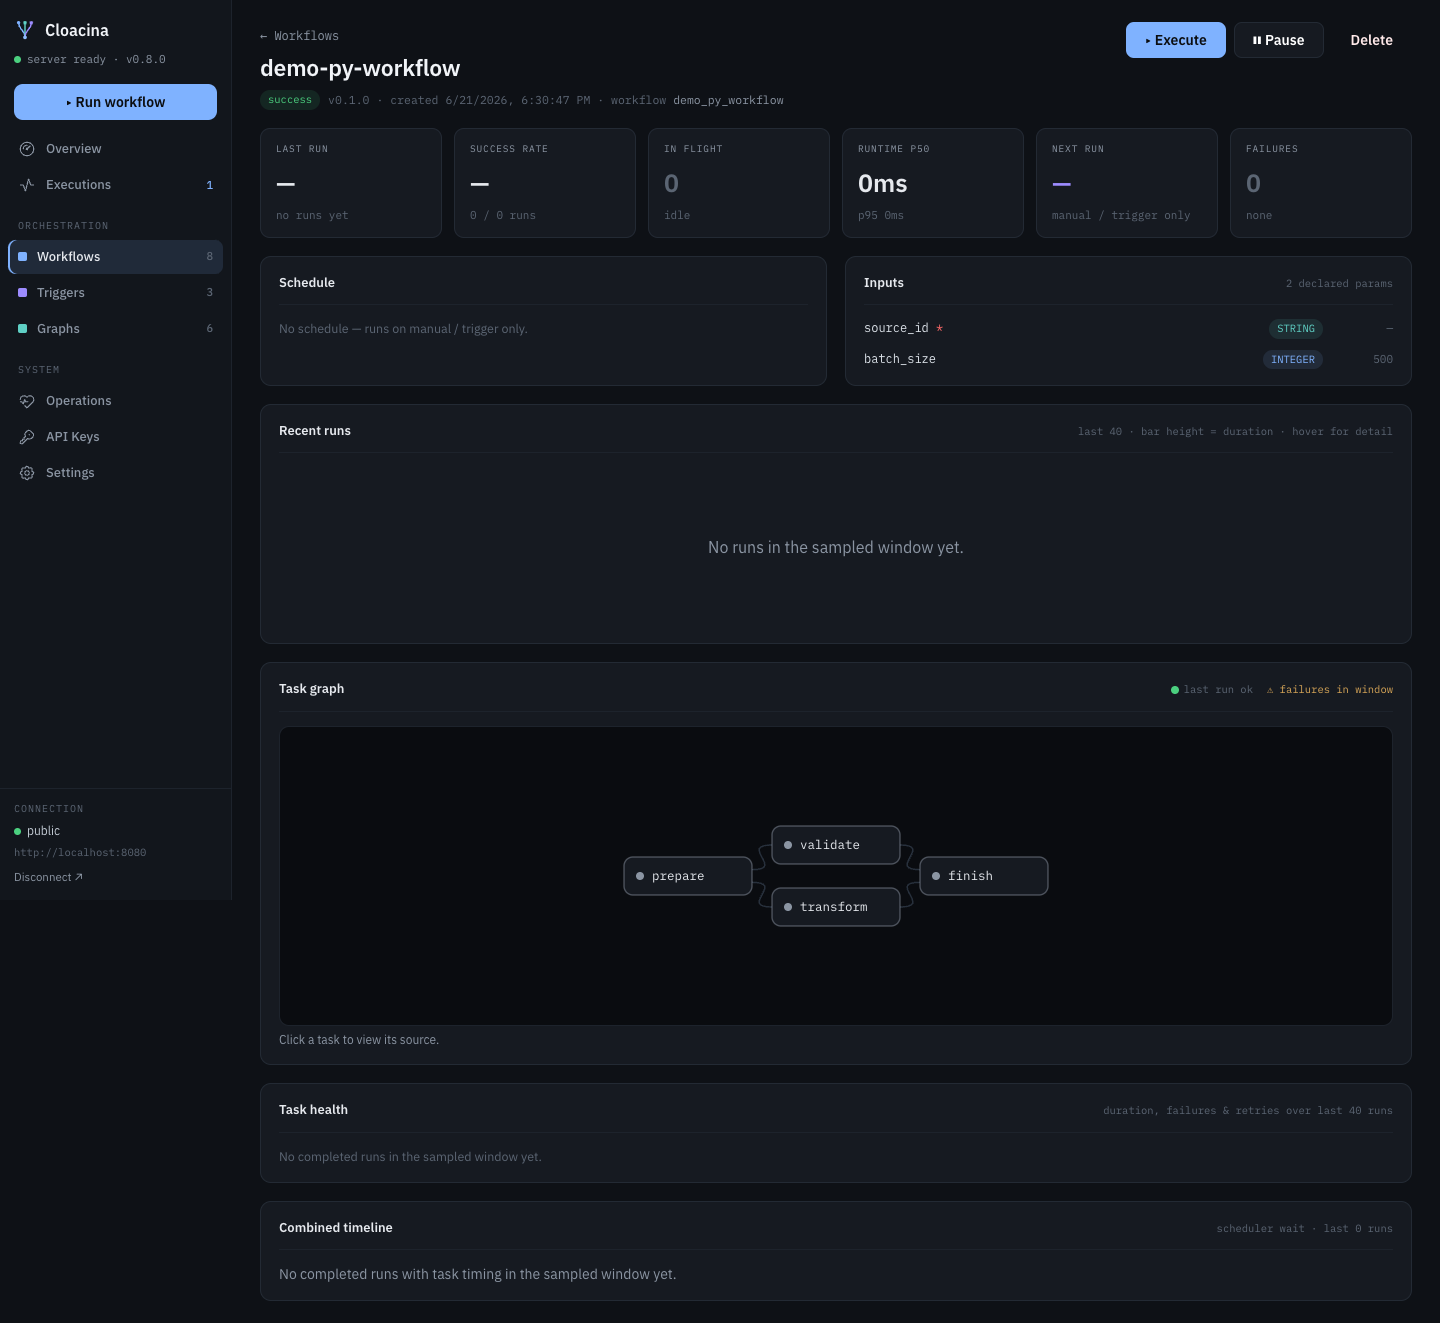
Opening a workflow gives you its operational detail: a status strip (last run, success rate, in-flight, runtime p50/p95, next run, failures), the Schedule card, an Inputs card listing the workflow’s declared parameters (typed, required vs defaulted), a recent-runs heatmap, the task DAG, and per-task health. Declared params here are exactly what the Run form asks you to fill in.
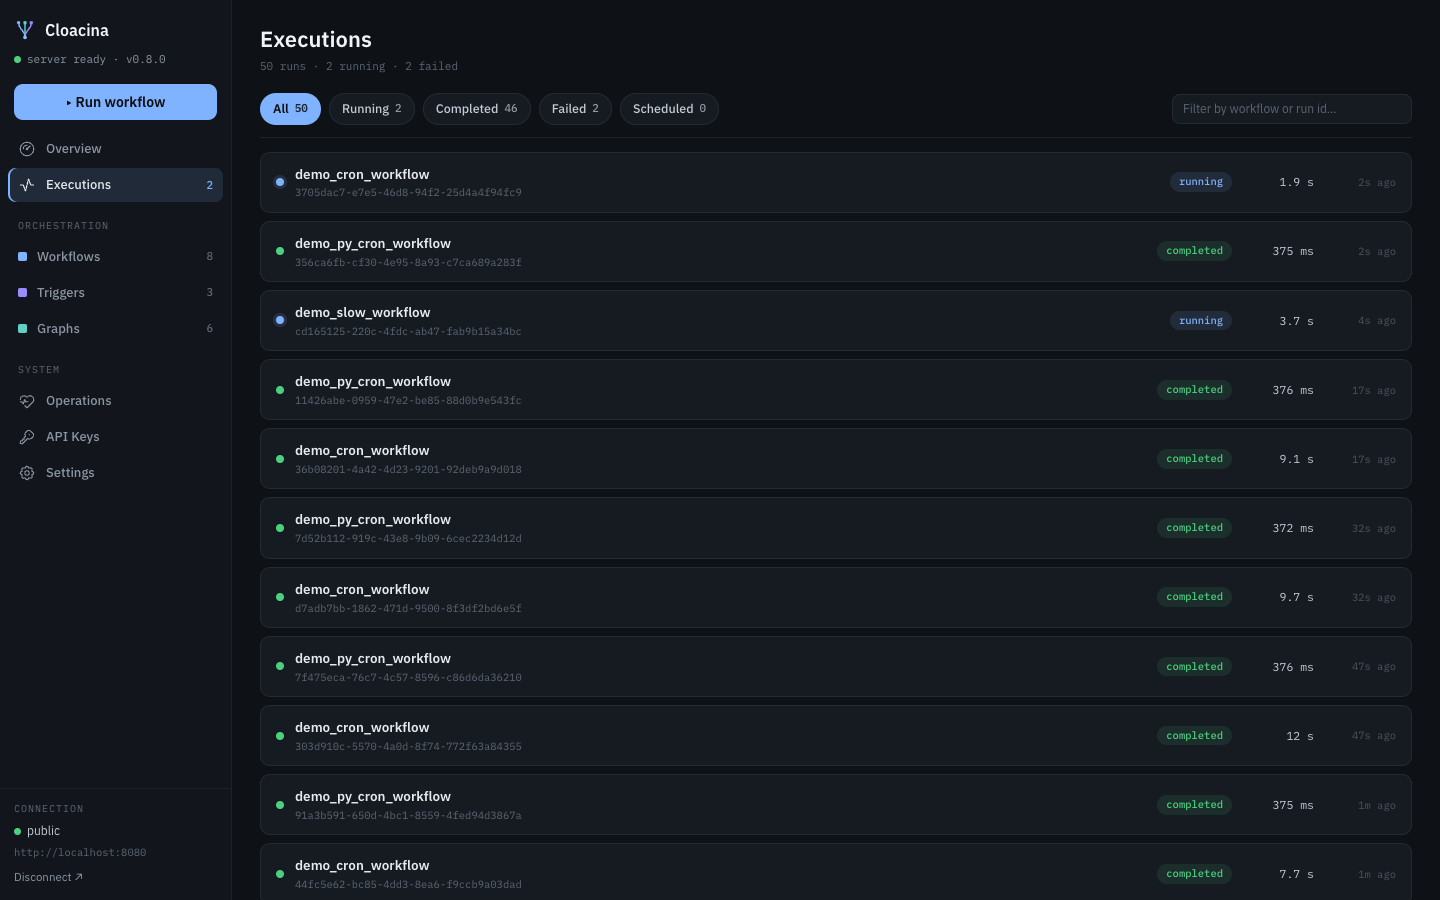
Every run, newest first, with status and timing.
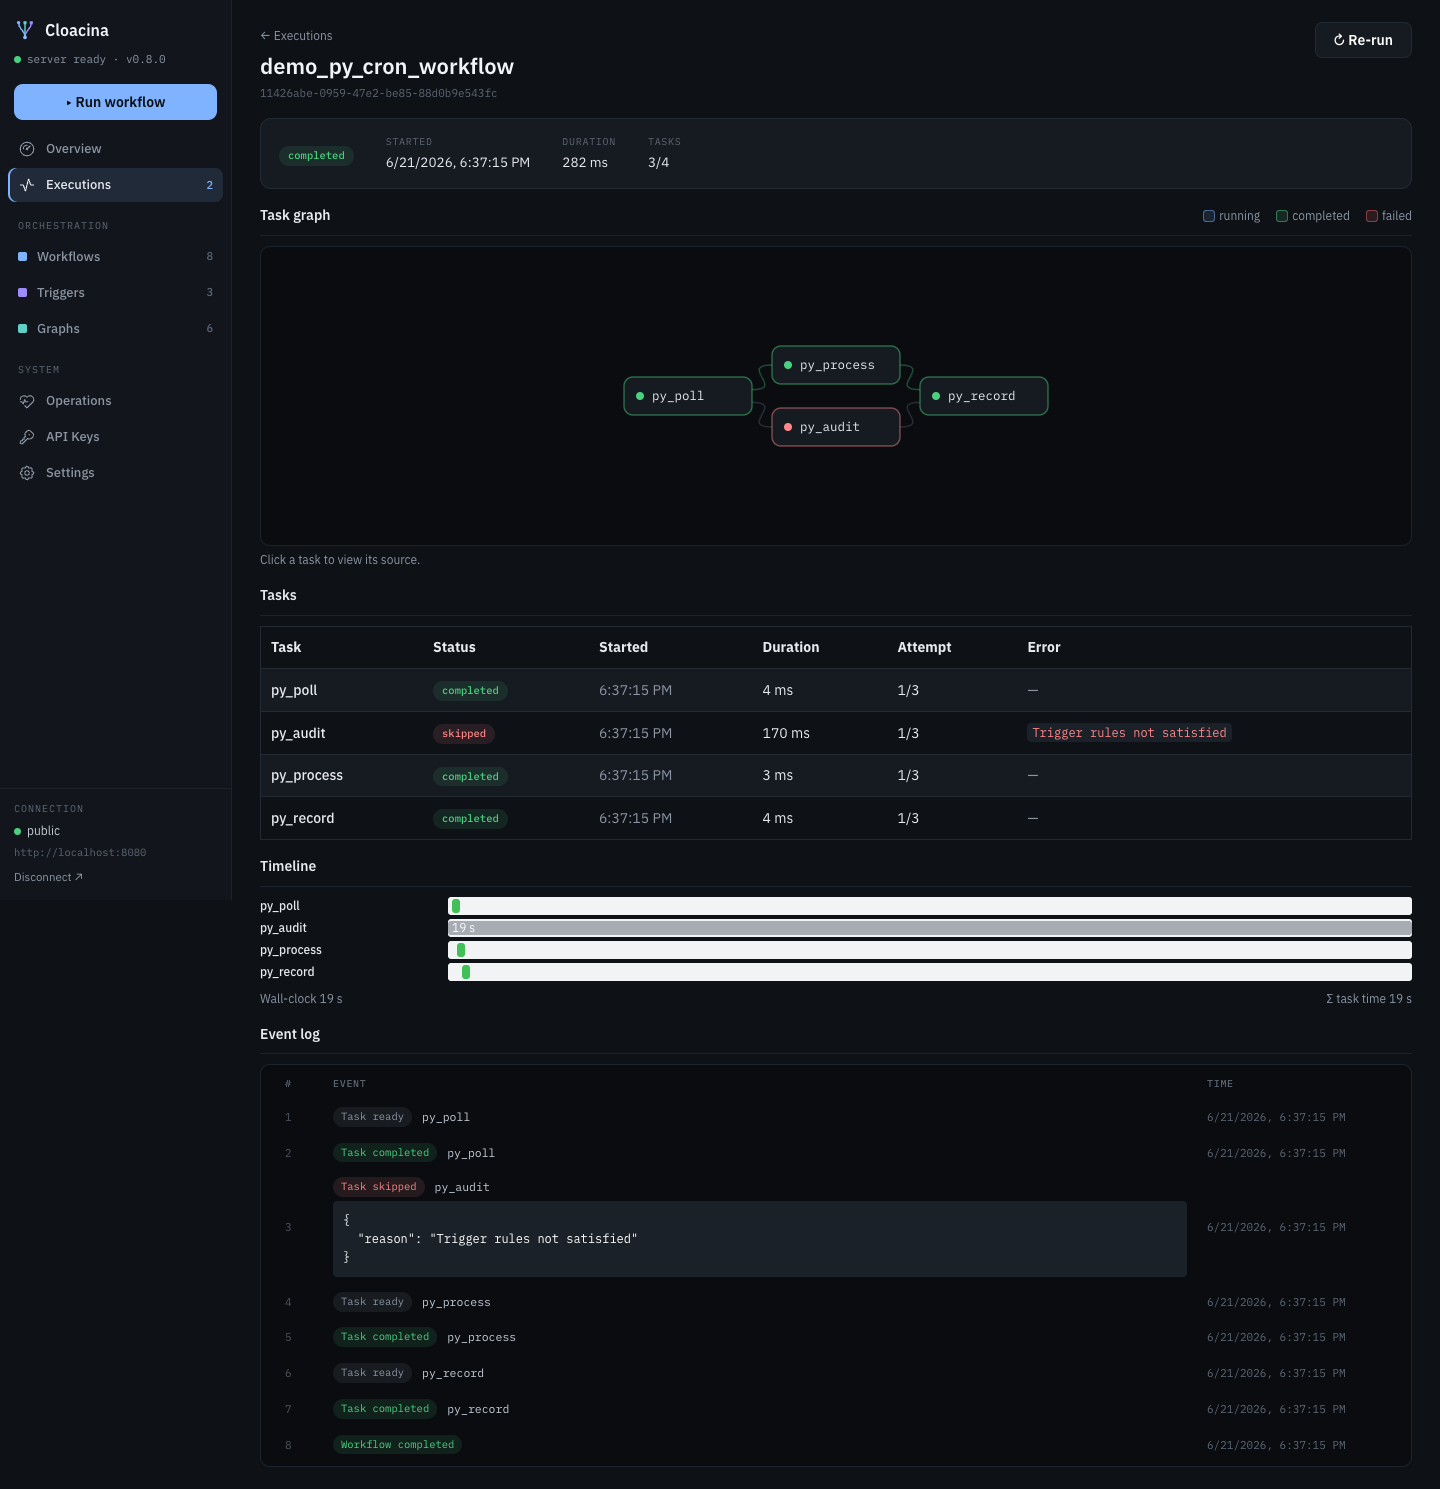
An execution’s detail shows the task graph colored by status — running (blue), completed (green), failed (red), and skipped (salmon, dashed: a branch not taken) — the task table, a timeline, and the live Event log. Click any task node to view just that task’s definition.
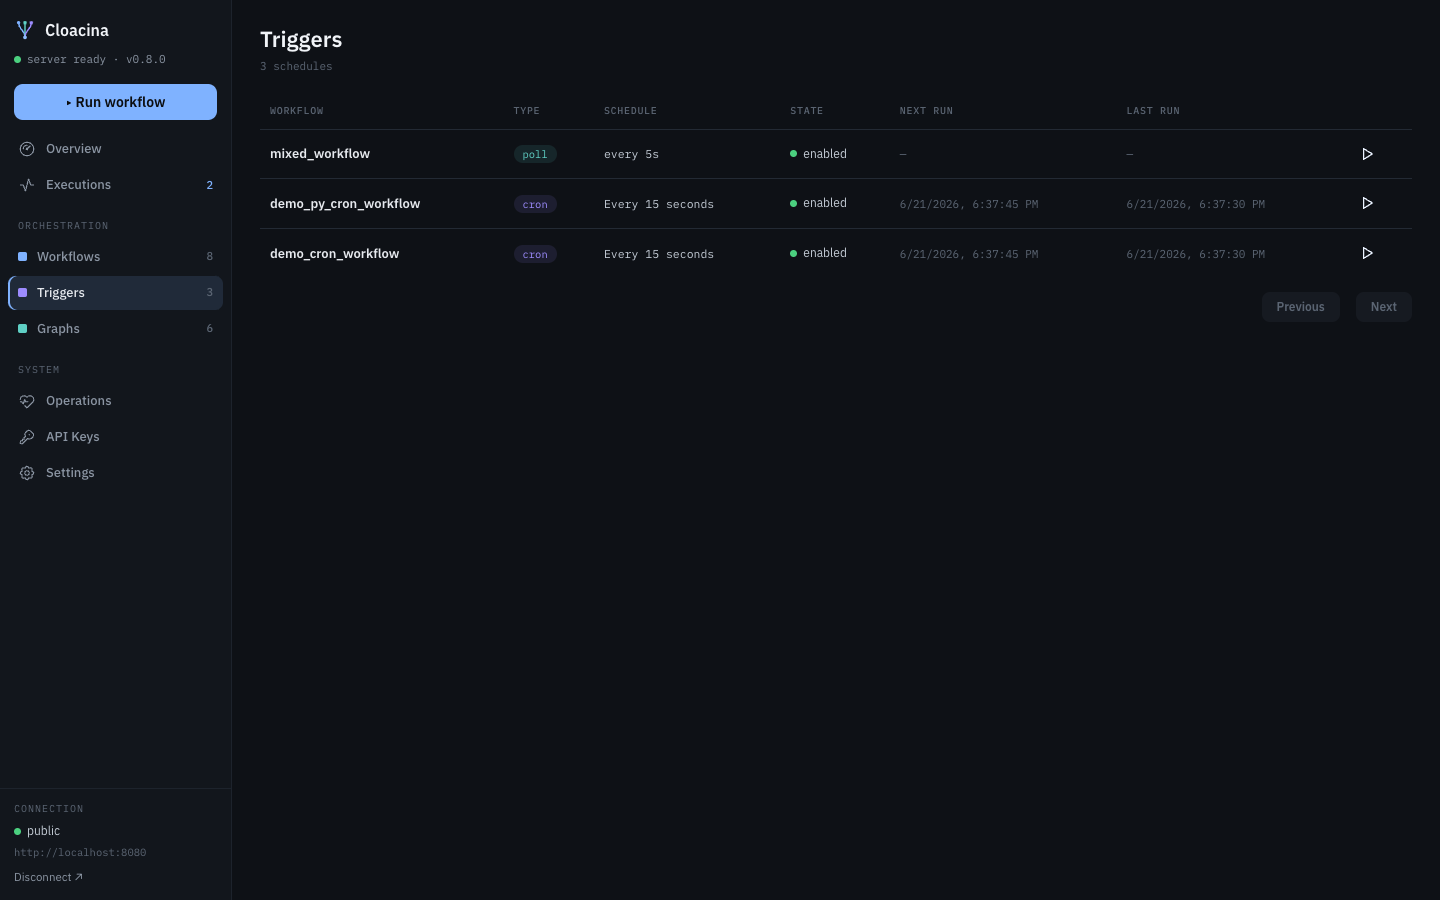
Scheduled and poll-driven workflow firings — cron expression (humanized), next/last run, and an enable switch.
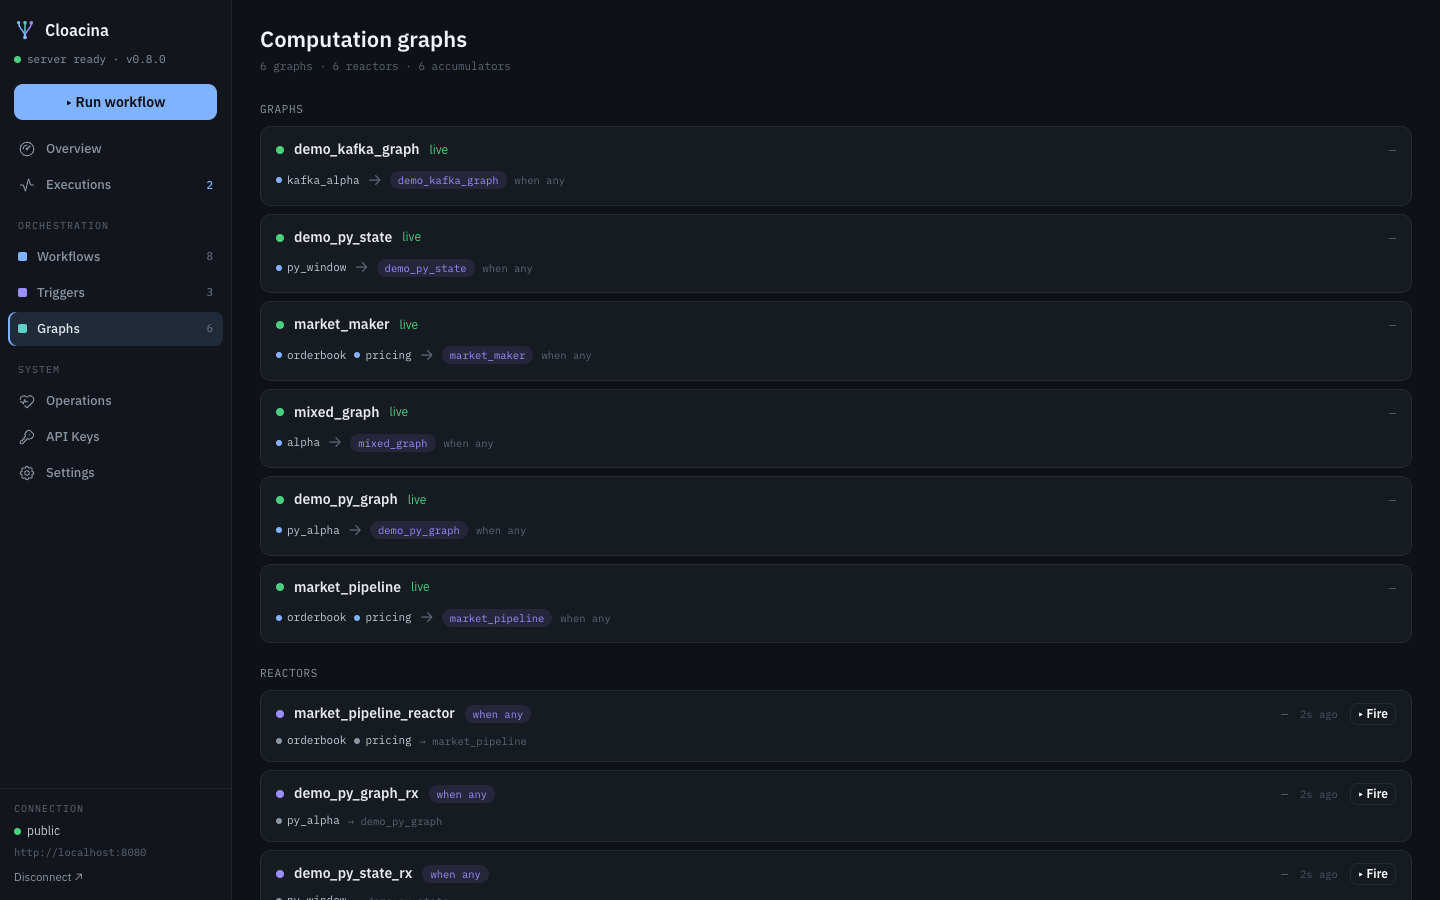
The computation graphs (reactors + accumulators). The list shows each graph’s health and topology at a glance.
A graph’s detail is the operational view for a running computation graph: a status strip (health, throughput, last fire, total fires, healthy sources, fire failures), a fire-activity heatmap (fires per minute, last hour), reactor readiness (per-source fresh/stale), an accumulators table with live freshness (state, last event, rate), the topology (degraded sources flagged), and a recent fires log with per-fire outcome and duration.
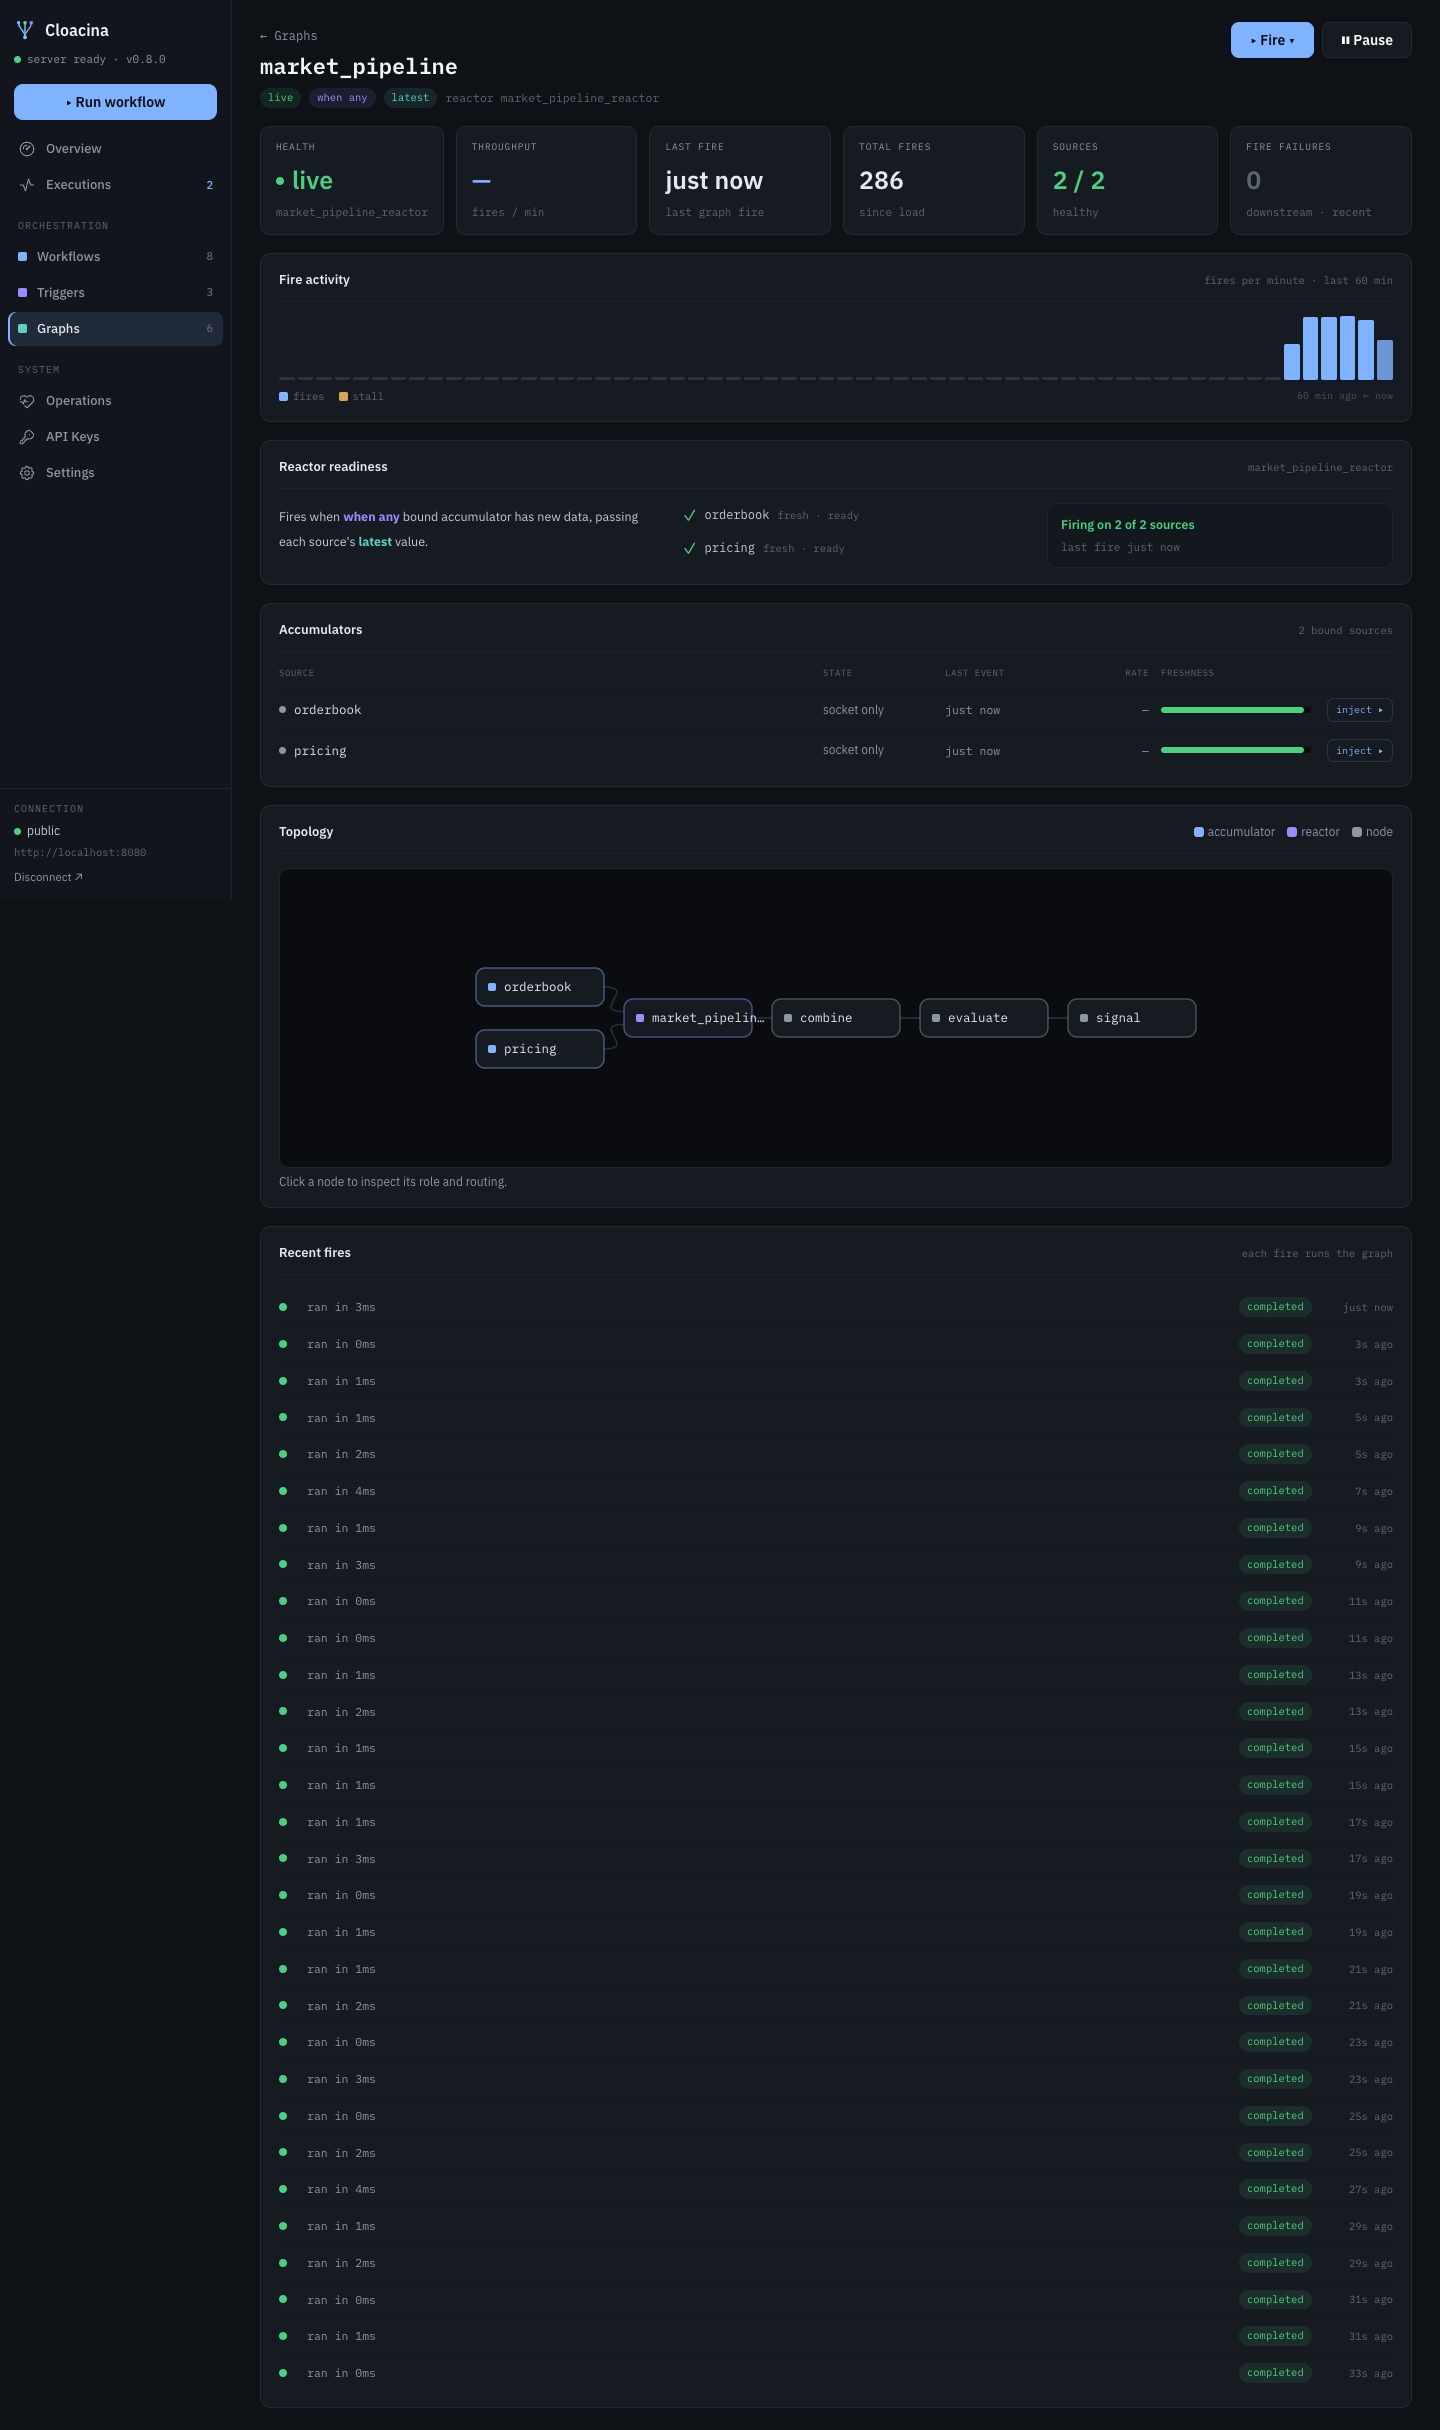
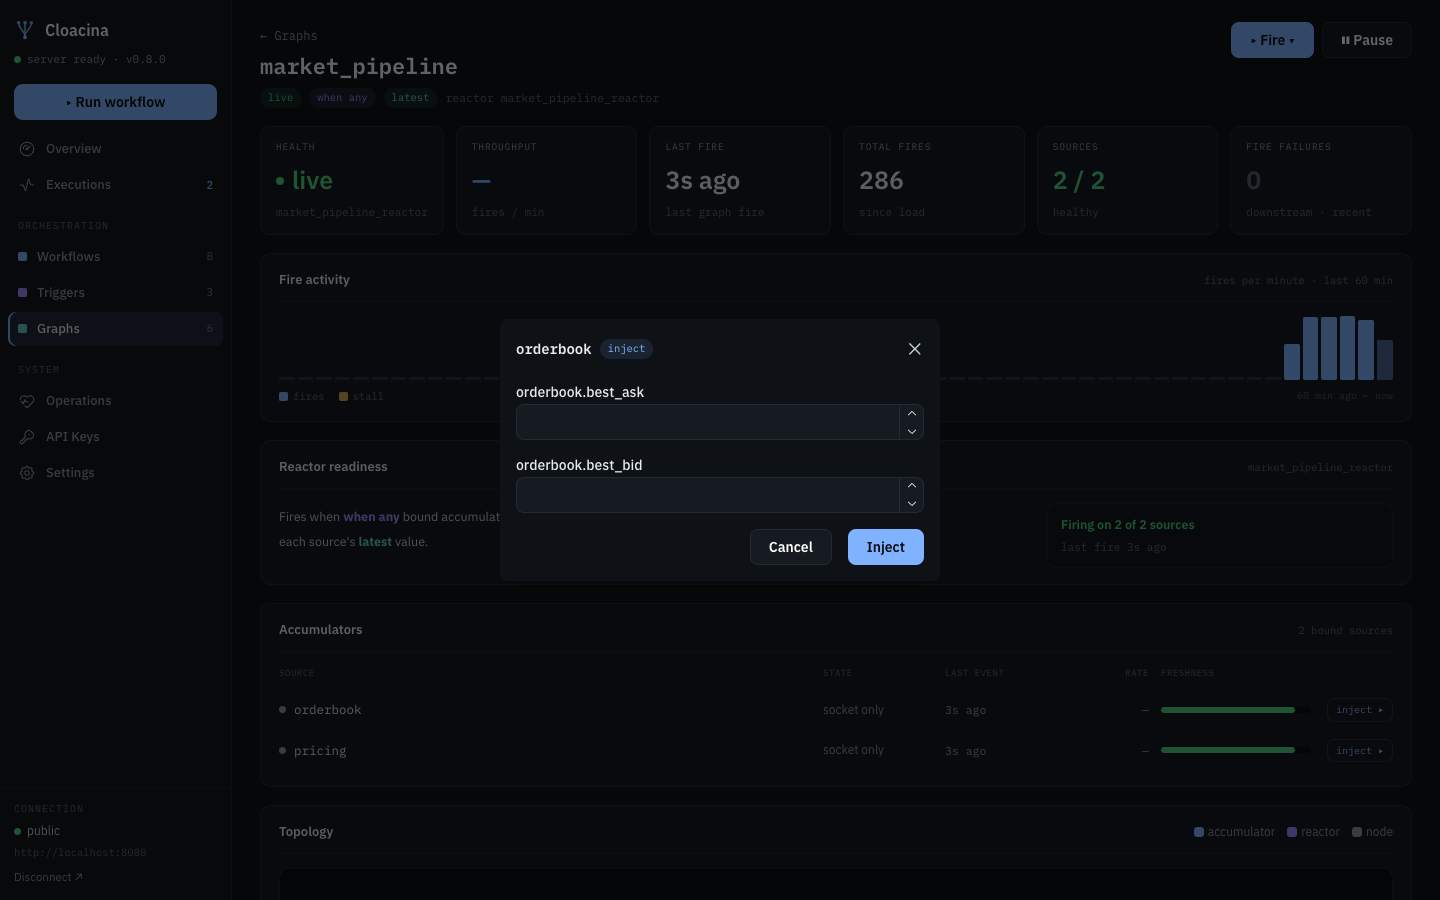
You can drive a graph by hand: Fire ▾ force-fires (or fires with typed inputs), and each accumulator row’s inject ▸ opens a typed form built from the source’s declared boundary schema.
Under System, the Agent fleet view shows this tenant’s execution-agent pool: Provisioned (the requested count), Running (agents currently registered), and the tenant’s Effective limit. A tenant-admin can scale the pool inline — Provision +1 (disabled at capacity) and Deprovision −1 (floor 0); read-scope users see the numbers without the controls. The controls are role-gated client-side, but the server enforces the same authorization regardless. See Execution-Agent Fleet.
You don’t need to seed anything. The stack ships with a continuous
workload: a driver fires demo_slow_workflow runs on an interval, a cron
trigger and a poll trigger fire on their own schedules, and the producer
streams market data into the computation graphs so they keep firing. So
the Executions, Triggers, and Graphs views all have live
activity from the moment you connect.
The demo also loads a spread of example packages — including a complex
20-task DAG (complex_dag_workflow) and several computation graphs — so
the catalog reflects real structure, not just toy single-task workflows.
Go to Executions. You’ll see runs accruing. Click an in-flight
demo_slow_workflow run: its detail view shows a live badge and the
Event log streams task events in as each of the five steps
completes, then flips to a terminal status when the run finishes. This
is the live delivery stream — the same WebSocket the SDK exposes,
deduplicated on sequence number.
Open a failed run to see its error and event history — the
debugging surface for demo_fail_workflow.
Go to Workflows → Upload, choose a .cloacina package, and upload
it. Once the compiler finishes building it, open its detail page and
click Execute (optionally with a JSON context) to start a run and
hand off to the live view.
- Deploy the web UI as a container against any server.
- Manage tenant API keys from the API Keys view (create shows the key exactly once — copy it then).